Stakeholder management
This is a part of research around the new tool for Wardley Maps, and about usage maps as a living documents.
Observation
A few persons reported doing problem exploration(or early analysis), where they were identifying stakeholders and their needs, and create a hypothesis of how the solution could look like.
Value Chains were not created, nor evolution assessed.
In the past, there was a request to export (to ppt or pdf) only stakeholders and user needs from Atlas2, without revealing the entire value chain.
Analysis
-
Thinking about stakeholders is one of the first steps when creating a Wardley Map.
-
It resonates very well with Burja Mapping and Onion Diagrams (both shown below)
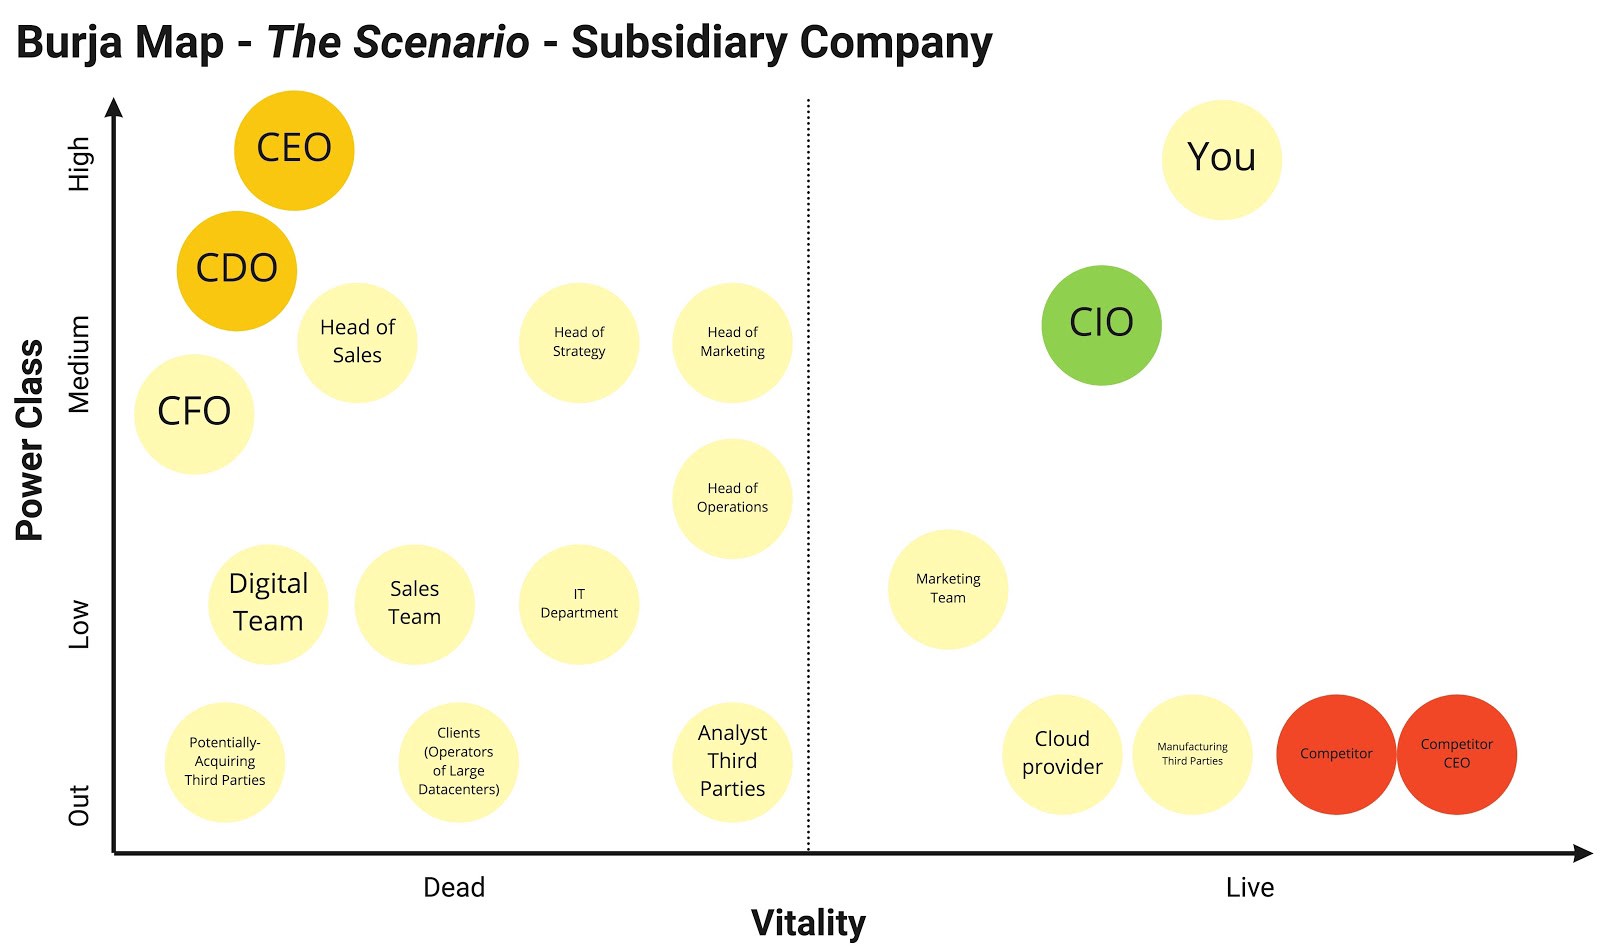
Burja Mapping (as proposed by @tasshin) shows allies and enemies. src: https://medium.com/@tasshin/foundations-of-burja-mapping-bddfd2874285
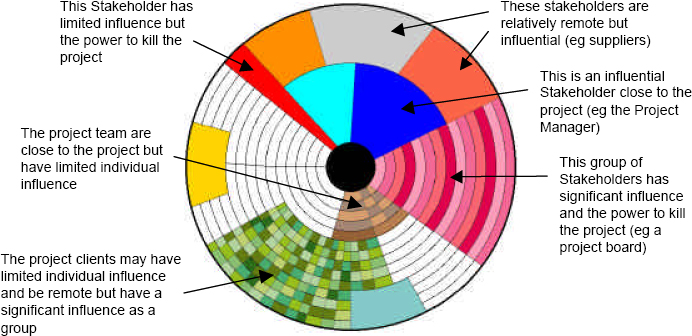
An Onion diagram showing project stakeholders. src: https://www.pmi.org/learning/library/project-relationships-stakeholder-circle-8092 -
Both approaches show how involved are stakeholders and what power they wield. That knowledge is useful for building coalition around a common goal. However, both approaches do not cover individual stakeholder desires and conflicts of interests. (Burja Mapping differentiates between friends and allies, though).
Needs, conflicts & competition
A typical stakeholder, let’s say, a CEO, has many mutually exclusive user needs:
- make a company profitable right now
- make a company profitable in the future
- get bonus
- maintain the work life balance
- run a competitive company
- pay well employees (a joke ;-), but who knows)
Those user needs are also often in competition with other stakeholders
- customers want to pay less (conflicts with making a company profitable)
- employees want to earn more (same conflict)
- shareholders want returns (supports profitability, does not support low pricing)
Etc. Etc.
Hypothesis
We need a diagram that helps us understand different perspectives. I am experimenting with a few different approaches:
Stakeholders, needs, capabilities and domains
We do not want to be caught in an unmanaged conflict of interests. For that reason, we want to identify each stakeholders (including those like a ‘Team B’ below, which are not involved into our initiative but are indirectly threatened by it). With that knowledge, we can:
- try to address conflicts before they emerge (compromise early)
- identify constraints for our solution that, when met, will allow for the project to happen and deliver value.
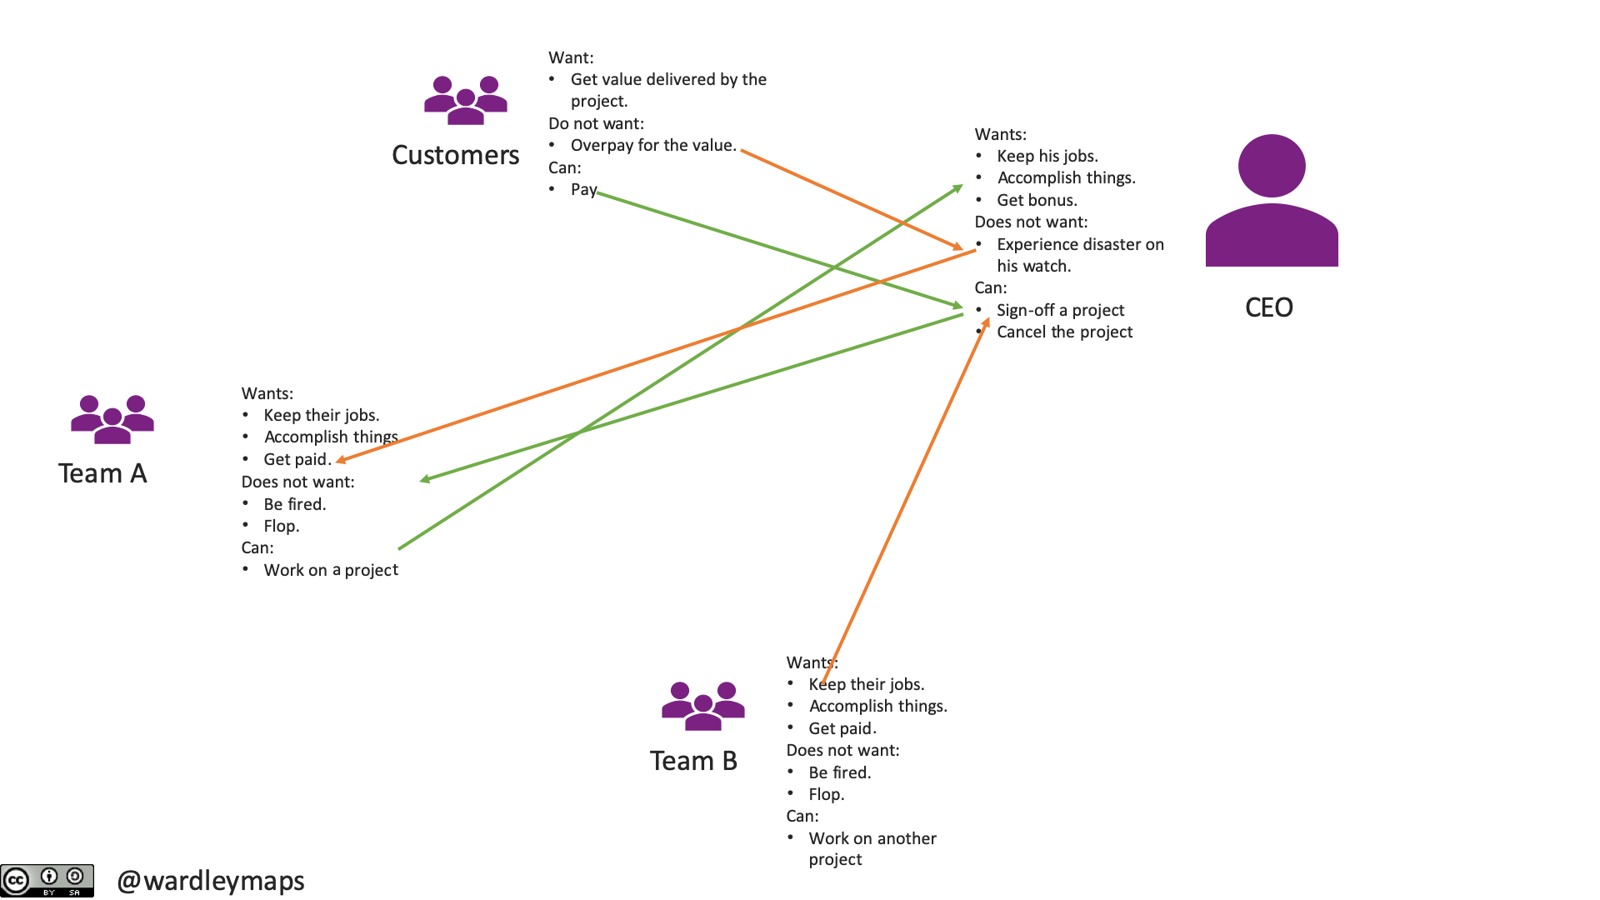
The diagram above shows four groups of users. Each user group has their ‘wants’, ‘does not want’ and ‘can’. The size of the user reflects the power, green arrow show positive reinforcements, orange one - conflicts.
Once this process is done, the diagram can bootstrap a Wardley Map (user, user needs), and serve as a list of constraints.